

WASHINGTON —The nation’s unions grew by 262,000 members last year, to 14.817 million and union density stayed at 10.7 percent, the Bureau of Labor Statistics announced, using data from the Current Population Survey of 60,000 households nationwide.
Union density in the private sector edged up 0.1 percent, to 6.5 percent, while public sector density stayed the same at 34.4 percent. There were 7.216 million public sector unionists last year, up 96,000 from the year before, and 7.601 million private sector unionists, up 166,000.
Unionists’ wage advantage over their non-union colleagues grew again, BLS said.
Median weekly earnings were $860 for each worker in 2017, the survey showed. But the median for unionists was $1,041, compared to $829 for non-unionists. The median is the point where half the group is above the figure and half below.
And the wage gap between working men and women was, as usual, small for unionists. The median pay for a working woman nationwide is 80 cents per dollar for a man in the same job. But the median for the unionized working woman ($970) was 88 percent of the median ($1,102) for the unionized man. A median non-union working woman earned $746 weekly, 88 percent of what the union woman earned and two-thirds of the male unionist’s median.
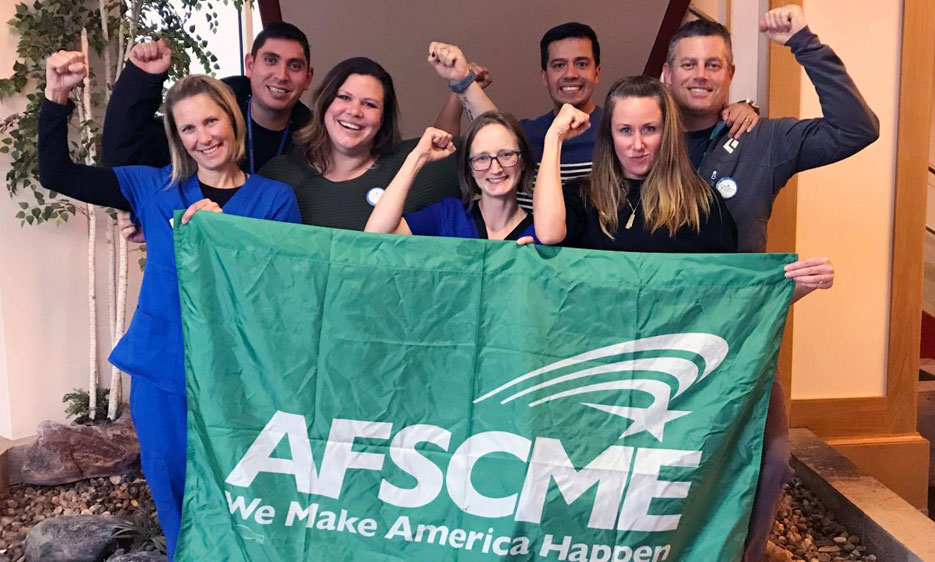
The public-sector unionist numbers could crash starting later this year. That’s because the Supreme Court will hear arguments on Feb. 10 on Janus v AFSCME District Council 31, a case pushed by the radical right National Right to Work Committee, and its cats-paw, dissident Illinois worker Mark Janus, to make every state and local government worker a “free rider.”
Unions expect the five GOP-nominated Supreme Court justices to throw out a 43-year-old precedent and make all state and local workers “free riders,” as if they resided in so-called right to work states. There were 576,000 such “free riders” – represented by unions but not members – in state and local governments last year, the BLS survey said.
The union record in right to work states is mixed, BLS calculated, though it warned that below the national level, survey samples are smaller and more open to error. Union density rose in Michigan and South Carolina, declined slightly in Missouri – where a RTW law is stalled by a successful union-launched petition to put it on the ballot – and dropped sharply in Indiana.
Federal workers right now could be free riders, even without Janus. BLS calculated 972,000 (26.6 percent) of federal workers were union members last year, down 34,000 (0.8 percent) from 1016. Federal worker unions represented another 159,000 free riders in 2017.
As usual, New York (23.8 percent) and Hawaii (21.3 percent) were the most-unionized states. Unions in the Empire State added 75,000 members, to 2.017 million, and Hawaii’s unions added 10,000, to 129,000.
South Carolina, which has a former union-buster as state labor commissioner and whose state government has hated unions for decades, finished dead last, again, in union density, at 2.6 percent (52,000 members). Membership numbers were unchanged.
The Palmetto State’s record was so bad that second-worst state, North Carolina, which overtook its sister state last year, widened its lead in union density. The Tar Heel state unions added 16,000 members, to 145,000, and density rose from 3 percent to 3.4 percent.
BLS said union members still are concentrated in the Northeast, the Great Lakes and the Pacific Coast. In sheer numbers, California topped the list at 2.491 million (-16,000 from 2016), followed by New York, Illinois (827,000, +15,000), Pennsylvania (665,000, -20,000), Michigan (658,000, +52,000), Ohio (635,000, +18,000) and New Jersey (630,000, -14,000).
Michigan had the second-largest increase in union density, +1.2 percentage points, to 15.6 percent, despite new state so-called right to work laws. Hawaii was first. Missouri lost 36,000 union members, to 226,000 (8.7 percent) and Minnesota gained 46,000, to 411,000, rising one percentage point, to 15.2 percent.
Among occupations, public safety and teaching were the most-unionized among government workers, while factories, utilities and construction led in the private sector.
African-Americans (12.6 percent of all workers) were more likely to be union members than whites, Hispanics (9.3 percent) or Asian-Americans (8.9 percent). Union density among Hispanic-named workers increased 0.5 percent in one year, BLS calculated.
The AFL-CIO viewed the figures positively. It said the increase in union numbers “reflects critical organizing victories across a range of industries, which have reaped higher wages, better benefits, and a more secure future for working people around the country.
“In the face of a challenging year, the power of working people is on the rise,” said AFL-CIO President Richard Trumka. “Together, we organized historic new unions, stood up to powerful corporations, and won higher wages.”
“But today’s data is more than numbers on a page, it’s a growing movement of working people that can’t be measured as easily. When more union members fill the halls of power, when wages rise and inequality shrinks, and when a growing number of people see that we can and will change the rules of this economy – that’s when you’ll know unions are on the rise.”
CONTRIBUTOR


Comments