How much does war, and the preparation and recovery from it, contribute to the climate crisis? Nobody knows, because there is no comprehensive accounting of global warming emissions from militaries, military industries, or war. While some military emissions are reported, those are the tip of the iceberg. The failure to quantify the emissions from this sector inhibits the ability to reduce them and keeps them largely sacrosanct.
One can make some educated guesses as to what they may be, which I’ve attempted here. This rough estimate—which is on the conservative side—shows that US and global military, military-industrial, and wartime emissions are enormous and should be factored into our understanding of global warming.
The procedures and criteria for nations to make a comprehensive report of their greenhouse emissions were first worked out as part of the 1997 Kyoto Protocol Treaty process.
A 1997 Pentagon memo—a piece of rhetorical genius—explained the stakes very clearly: The military was the US government’s single largest fossil fuel user. Ensuring the US military remained preeminent in the world required unlimited fuel use for training and operations. Reporting emissions could lead to a push for reductions, and “limitations on tactical and strategic military systems would … adversely impact operations and readiness.”
The Pentagon argued that even a 10 percent reduction in fuel use would harm military readiness and “represent a serious threat to national security.”
To forestall this, the Pentagon suggested draft language for the Kyoto treaty proposing that parties “shall exclude from its measurement of anthropogenic emissions by sources any emissions attributable to military tactical or strategic systems used for military operations in support of national or collective security, humanitarian activities, peacekeeping, peace enforcement, or United Nations, NATO, and other multinational actions.” The Pentagon also proposed excluding measurement of any “emissions attributable to military tactical or strategic systems used in training” for those operations.
The Defense Department also asserted that “to minimize fundamental conflicts between national security and global environmental protection, the Protocol itself must address military operations and readiness so that the [sic] we can pursue and enjoy the fruits of national security as well as the benefits of a healthy planet.”
The White House agreed, and the United States successfully lobbied to exempt most military emissions from countries’ annual National Inventory Reports of greenhouse gas emissions.
Even though military emissions reporting was made voluntary in 2015 at the UN’s climate conference in Paris, there is still no comprehensive accounting of direct military emissions by all countries. But even if and when those institutional numbers are reported, most accounting is still partial because it undercounts military emissions and excludes the emissions from military industry and war. Every uncounted metric ton is an obstacle to grasping the full scale of the problem and hampers the ability to reduce the worst effects of warming.
US military emissions. The US Defense Department is still the single largest energy user and institutional greenhouse gas emitter in the country. And that is before we account for all the national security related emissions that are counted as emissions in other departments. Indeed, as I show below, there are significant military related emissions that are essentially under or uncounted.
Let us begin with begin with Defense Department reported energy use and emissions. The figure below shows greenhouse gas emissions from US Defense Department energy use from 1975 to 2024. It includes my calculations of US military emissions (based on energy use) from 1975 to 2009, and the Energy Department’s report of Defense Department emissions from 2010 to 2024.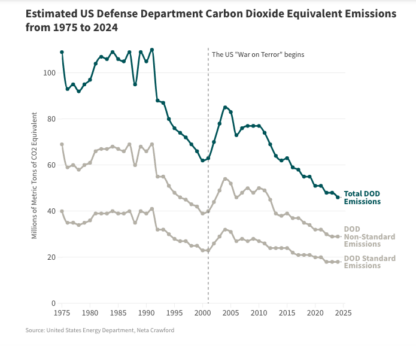
I focus here on the Defense Department’s emissions since the end of the Vietnam War. Between 1975 and 2024, the Defense Department emitted 3,983 million metric tons of carbon dioxide equivalent, an average of 80 million tons each year.
Of these, emissions from bases and operations fluctuate depending on US military activities—higher when the United States is mobilizing and fighting and falling during peacetime and demobilization. Since there are no emissions reported for the CIA’s drone strikes and other operational emissions, I assume those are included in the Defense Department’s emissions.
Defense Department emissions are lower overall now than during the Cold War because the number of US overseas bases has shrunk from around 2,000 to about 700. The Defense Department has also decreased its use of coal and, since the early 2000s, sought increased fuel efficiency for its forces in a bid to “unleash” itself from “the tether of fuel” and increase the use of renewable energy. These efficiencies, the Defense Department emphasizes, are for tactical reasons: Transporting fuel in war zones or running out of fuel during operations create vulnerabilities that the military would understandably prefer to avoid.
But most significantly, Defense Department emissions have fallen because many of its functions are now essentially off-book, as the US military has increasingly outsourced its operations to contractors.
Nearly 4,000 million metric tons of carbon dioxide equivalent is a large quantity, but this is a conservative estimate since the Defense Department, which provides the data to the Energy Department, uses a lower 100-year Global Warming Potential for methane than the Intergovernmental Panel on Climate Change. My estimate also does not include the Defense Department’s biogenic emissions (from organic waste decay), which averaged .78 million metric tons of carbon dioxide equivalent from 2010 to 2024.
The Defense Department is not the only agency that contributes to military power and security. Although it is a civilian agency, NASA has collaborated with the Defense Department to conduct research and sometimes shares facilities and launches. Nor are Department of Homeland Security emissions included, even though the agency has housed the Coast Guard since 2002 and it performs other national security functions. Its non-standard emissions for military operations, law enforcement, and “other” activities—which averaged .87 million metric tons of carbon dioxide equivalent from 2010 to 2024—were .77 million metric tons of carbon dioxide equivalent in 2024.
Similarly, while the Energy Department has civilian functions, it has military functions as well, including the design, development, and production of nuclear weapons. The Energy Department reports that it emitted an average of 2.8 million metric tons of carbon dioxide equivalent annually between 2010 and 2024. Less than one percent of those emissions were for “non-standard” activities (military operations, law enforcement, etc.). However, it is difficult to know the full extent of Energy Department emissions that contribute to military capability since it is unclear whether the emissions generated at these facilities are included in annual emissions reports.
The Energy Department jointly oversees, with the Navy, the naval nuclear reactor and propulsion programs. Some of the nuclear weapons and nuclear reactor related greenhouse emissions are already presumably included in my estimate if they are part of the Defense Department. For example, Portsmouth Naval Shipyard, which produced 72,231 metric tons of carbon dioxide equivalent in 2023, falls under the remit of the Navy. Similarly, the nuclear shipyard emissions of Electric Boat, owned by General Dynamics, and the emissions of Newport News Shipbuilding, owned by HII, are already included in my estimate of military-industrial emissions, discussed below.
Nuclear weapons facilities in the United States are known to release radionuclides, like Tritium, Krypton 85, Strontium 90 and Plutonium 238, into the atmosphere. But they also emit greenhouse gases. Sandia National Laboratory emitted 94,233 metric tons of carbon dioxide equivalent in 2024. The Pantex facility in Texas, which assembles and tests nuclear weapons, reports that in FY 2024 they emitted a total of 75,906.9 tons carbon dioxide equivalent. Of this total, 19,298.8 metric tons of emissions were from the combustion of natural gas, 27,592.3 tons from off-site electricity, and 29,015.8 tons were due to other indirect greenhouse gas emissions. The Y-12 plant, which refurbishes and manufactures components of nuclear weapons, emitted 42,083 metric tons of carbon dioxide equivalent in 2023.
In other words, the combined annual emissions of just three US nuclear weapons facilities—Sandia National Laboratory, Pantex, and Y-12—are about 20 times more than the Energy Department’s reported “non-standard” emissions in 2024.
Emissions from other Energy Department nuclear and conventional weapons related facilities and functions are not reported and, at national labs where there are multiple civilian and military lines of research (such as Los Alamos and Lawrence Livermore National Lab), it may be impossible to attribute emissions to civilian or military applications. Similarly, the Idaho National Laboratory in Idaho Falls, which conducts research on conventional weapons, nuclear non-proliferation, and nuclear energy, emitted more than 60,000 tons of carbon dioxide equivalent in the 2022 fiscal year.
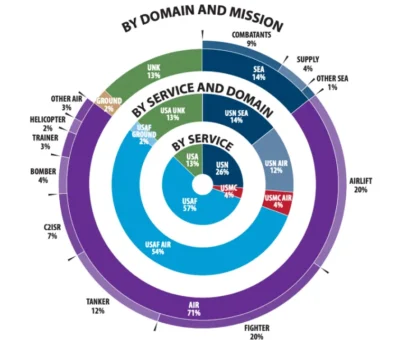
Uncounted US military emissions. Total Defense Department emissions are likely larger when we factor in two sources of emissions that are rarely discussed. The first stems from the heavy reliance of the military on air power for fighting, transportation, and reconnaissance, and of course, tankers for refueling all those assets. The emissions reported here are from fuel used and energy purchased by the Defense Department. Jet fuel consumption is the largest portion of operational emissions—around 70 percent. Indeed, the preference for air strikes seems to be growing: During the first 38 days of combat against Iran in 2026, the United States made more than 10,200 sorties—more than the US and its allies made in Afghanistan during all of 2021.
Jet fuel combustion produces both carbon dioxide and non-carbon dioxide heat-trapping gases, including water vapor. When aircraft fly at altitudes between 26,000 and 42,000 feet, water vapor creates condensation trails (contrails) and contrail cirrus clouds that trap heat. These have a larger radiative forcing effect than carbon dioxide alone. The Air Force does not estimate radiative forcing effects; doing so would add significantly to military operational emissions.
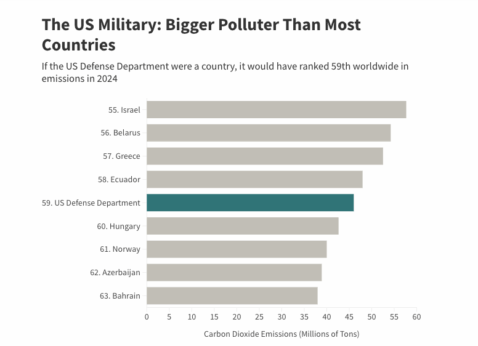
Without adjusting for aircraft radiative forcing, the Defense Department’s total emissions were about 46 million metric tons of carbon dioxide equivalent in 2024. This is higher than most countries’ annual emissions. If the Defense Department were a country, its 2024 emissions would put it just above Hungary, ranked 59 out of 207. But using a recommended radiative forcing index for aircraft emissions would increase total Defense Department emissions in 2024 to about 66 million metric tons of carbon dioxide equivalent, making it the world’s 51st largest emitter, with emissions greater than the combined emissions of Sweden and Denmark. Including radiative forcing, average annual Defense Department emissions from 1975-2024 are estimated to be 115 million metric tons of carbon dioxide equivalent.
Emissions from the private security sector—also known as military contractors—constitute a potentially much larger source of uncounted emissions. Since the 1980s, contractors have performed many functions formerly performed by the armed forces—embassy protection, fuel transport, military and police training, and base security. This outsourcing accelerated after 9/11, and private security forces were a crucial element during the US wars in Iraq and Afghanistan.
During the US wars in Iraq and Afghanistan, contractors sometimes outnumbered US military personnel. The Congressional Research Service found that at the peak of the US military presence in Iraq, in the first quarter of the 2008 fiscal year, there were slightly more contractors in Iraq than United States military personnel—161,783 US troops to 163,531 contractors. In 2017, there were more than twice as many contractors on the ground in Afghanistan: 23,659 contractors to 11,100 US troops. In mid-2025, Central Command had 6,301 contractor personnel working in Iraq and Syria and an additional 14,055 in other Central Command locations.
Even when the United States is not at war, contractors play a significant role. In 2023, there were about 1.2 million active-duty services members, compared to 934,772 full-time equivalent contract personnel working for the Army, Navy Air Force, and Special Operations Command. While the number of contractors working for the services declined in 2024, that number likely increased in 2025 and 2026.
Contractors are an important, albeit difficult to quantify, source of emissions. While some military contractors report emissions, most do not. Those that do, such as KBR, do not differentiate their emissions by activity. Others, such as DynCorp International, which played a large role in the Iraq War, became a subsidiary of Amentum, a larger federal contractor, in 2020, and its emissions are presumably included in Amentum’s reported emissions.
Military-industrial emissions. Military industry—which builds the durable equipment used by militaries—is also a significant source of emissions. The Stockholm International Peace Research Institute estimates that in 2024, US arms manufacturers constituted six of the top 10, and 39 of the top 100 arms manufacturers globally. US arms manufacturers supply the military forces of many countries and US companies dominate arms exports, making up 42 percent of the global market in 2025. The major US military industries are supplemented by nearly 25,000 small businesses contracted with the Defense Department in 2020, along with hundreds of other manufacturers.
Several of the top US-based defense companies, including SpaceX, Mitre Corproration, The Aerospace Corporation, General Atomics, and Sierra Nevada Corporation, appear to not publish their emissions. Using data publicly available from roughly three-quarters of the top 39 US defense companies and contractors, I estimate that the top 39 US arms manufacturers scope 1 (energy consumed on site or directly by the company) and scope 2 (from energy purchased from another supplier) emissions were 6.6 million metric tons of carbon dioxide equivalent in 2024, not including their supply chain (upstream) or downstream emissions. While it is possible to calculate the emissions from all upstream and downstream activities (scope 3) most companies do not report this information. Including upstream supply chain goods and services and additional energy use (a ratio of scope 1 and 2 emissions to upstream scope 3 emissions of 1 to 6.63), I estimate that the emissions of the top 39 US military-industrial corporations in 2024 were at least 56.5 million metric tons of carbon dioxide equivalent.
This is a conservative estimate for several reasons. First, research shows that many companies initially underreport and then later revise their reported emissions upwards.
Further, I have not estimated emissions from all US based defense industries. The Congressional Research Service estimates that there are nearly 60,000 companies employing more than 1 million people in the defense industry in the United States. The Institute for Defense & Business counts more than 100,000 companies in the US defense industrial base. Many of these companies do not report their emissions. For example, Sig Sauer, the largest supplier of handguns and rifles to the US military, is not one of the world’s top 100 arms companies, and it does not report its emissions.
My estimate of US military-industrial emissions does not include government-funded research institutes. I assume that the Defense Department’s 10 Federally Funded Research and Development Centers emissions are included under the relevant arm of the Defense Department that funds them. I have also not included estimated emissions for the 24 University Affiliated Research Centers, a portion of whose activities directly contribute to the defense industrial base but whose emissions are not included in any accounting of military emissions.
In sum, there are known-knowns and known-unknowns, as the figure below illustrates. The emissions reported by the Defense Department are a large portion of US military and military-industrial emissions, but there are several important categories of emissions where data is incomplete, and we can only guess or estimate.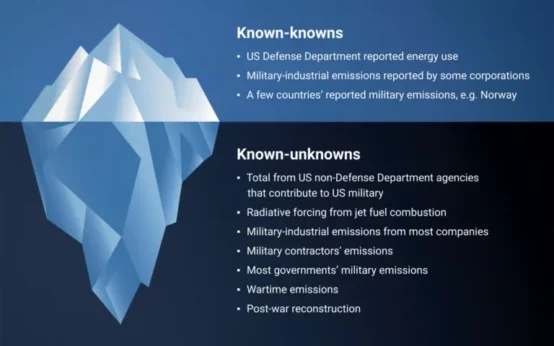
Global military emissions. If it is hard to account for all US military and military-industrial emissions, estimating global military emissions is even more difficult. The Conflict Environment Observatory, which tracks military emissions data, has found that almost no country reports its military emissions to the UN Framework Convention on Climate Change. Some countries report stationary emissions (bases and installations) in their national submissions, but for most, there is almost nothing.
Norway is one of the only countries in the world that publishes its military energy consumption and total military emissions (including scope 3 inputs and outputs), which were 1.3 million metric tons of carbon dioxide equivalent in 2023 and 1.44 million metric tons in 2024.
While it purchases many weapons from other manufacturers in the United States and other countries, Norway has a military-industrial sector, and given its relatively small size, it is possible to estimate its emissions. Kongsberg, Norway’s largest defense contractor, reported its emissions from energy purchased and used at 23,544 tons in 2024 and 19,890 tons of carbon dioxide equivalent in 2025. Nammo, Norway’s second largest military company, supplied rocket motors and ammunition and other weapons to European countries and Australia in 2025; it reported total emissions of 46,783 tons of carbon dioxide equivalent in 2025.
But apart from estimates of US military emissions and Norway’s voluntary reporting, military emissions remain mostly unreported and uncertain. Further, many of the largest military industries do not consistently report their emissions or the emissions for the materials they use to make equipment, known as upstream inputs. And there is little to no data on the emissions of smaller arms manufacturers. There is also little data on the emissions of military contractors who increasingly provide essential services for the military that used to be performed by the military itself.
Without adjusting for purchasing power parity, the United States accounted for about 33 percent of total military spending in 2024 and 2025, and the Russian and Chinese military spending respectively accounted for about 5.5 and 12 percent of world military spending in 2024, and 6.6 and 12 percent of total military spending in 2025. Using my estimate of US military emissions in 2024, without correcting for purchasing power differences of spending, I estimate that global military emissions were at least 201 million metric tons of carbon dioxide equivalent in 2025. But as Stuart Parkinson, executive director of Scientists for Global Responsibility, has pointed out, emissions estimates should be adjusted for other military powers whose economies can purchase more per expenditure than the United States. Adjusting for purchasing power parity, US military spending accounted for about 25 percent of global spending in 2024.
I estimate that global military emissions were at least 266 million metric tons of carbon dioxide equivalent in 2024. Using the conservative estimate of US military-industrial emissions as a starting point, I estimate that the emissions of the top 100 military industries in 2024 were about 135 million metric tons of carbon dioxide equivalent, including upstream supply chain goods and services.
Adding my estimate of global military and military-industrial emissions, my conservative estimate is that global military and military-industrial emissions range between 336 and 400 million metric tons of carbon dioxide equivalent, depending on corrections for purchasing power parity. If that is so, the world’s military and military-industrial emissions in 2024 would be similar to the annual emissions of Australia and Italy, ranked 17th or 18th respectively.
This estimate is extremely conservative because it does not include all defense contractors in the United States or all upstream supply chain emissions. And there are ripple effects in economies: Research shows that high levels of military spending and emissions are correlated with higher overall national emissions. Military installations can also harm local forests and wetlands—diminishing the effectiveness of these carbon sinks.
My conservative estimate of world military and military-industrial emissions is lower than other estimates. In late 2025, Tipping Point North South estimated US military and military-industrial emissions to be 219 million metric tons of carbon dioxide equivalent in 2024 and total emissions by NATO, China, and Russia at 551 million metric tons. In 2022, Parkinson and the UK-based environmental analyst Linsey Cottrell estimated that the global military and military-industrial sector generated 1,644 – 3,484 million metric tons of carbon dioxide equivalent emissions in 2019—between 3.3 and 7 percent of total global emissions—in 2019. Their estimate does not include radiative forcing effects but does adjust for purchasing power parity.
These higher estimates may be closer to the truth. But even then, we still need to account for wartime emissions.
War and post-war reconstruction. War and post-war emissions are another area where accounting is poor and, until recently, we knew little about how much war affects emissions through destruction and post-war reconstruction. War itself not only burns fuel, buildings, and forests; over the long run, it harms the ability of the natural environment to sequester carbon. War also hurts agricultural and industrial activity, which can decrease emissions from those sectors in the short term, but this is temporary and in general recovering and rebuilding after war is incredibly greenhouse gas intensive.
Table 1 describes several categories of war related emissions. These effects are due to deliberate targeting and the inadvertent emissions from environmental damage, wartime adaptation, and post-war reconstruction.
States will deliberately destroy the forests of their enemies. The United States used chemicals, bombardment, and plows to destroy 417,000 hectares (roughly 1,600 square miles) of tropical forests and mangroves of Southern Vietnam during the Vietnam War, releasing an estimated 183.6 – 535.6 million metric tons of carbon dioxide equivalent emissions. An additional 5.6 million hectares (or 21,600 square miles) of forests were partially destroyed. If damaged forests are not regrown, their sequestration potential is reduced or even eliminated.
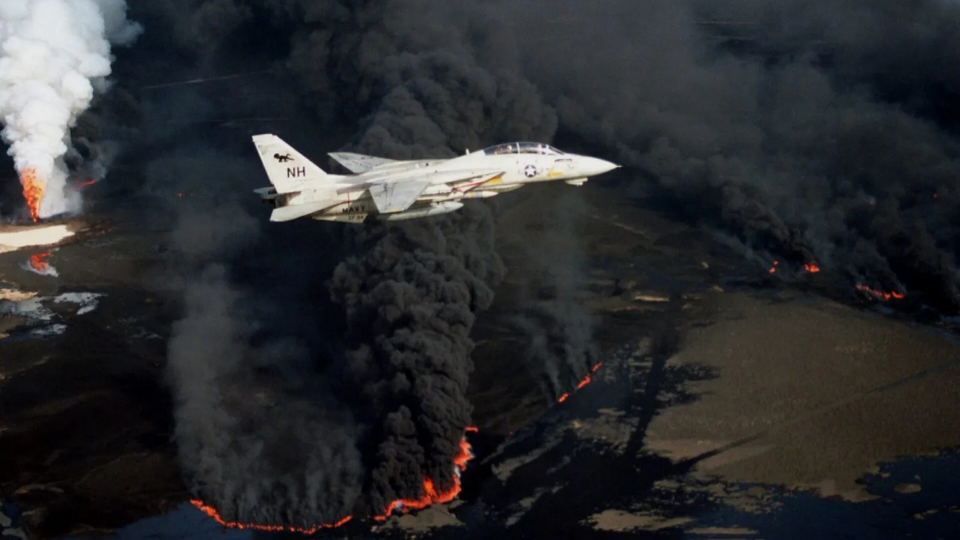
States often deliberately attack fossil fuel infrastructure during war, such as when the United States and Britain bombed German and Japanese petroleum refineries and storage facilities in World War II. During the 1991 Gulf War, Iraq destroyed more than 1,160 Kuwaiti oil wells. Of the oil wells that were attacked, more than 600 were set alight, and many of those fires burned for months. The fires contributed an estimated 1.5 percent of the worldwide annual emissions of carbon dioxide that year. Resulting oil spills also contaminated wetlands, reducing their ability to sequester carbon.
More concerning perhaps are the ways that war contributes to fugitive methane emissions—from slow leaks, deliberate venting, and accidents—that are already a large source of warming. Methane has a 29.8 times higher global warming potential on a 100-year time scale than carbon dioxide. War related emissions of methane, which vary depending on the source and cause of the emissions, largely go uncounted. During the 1991 Gulf War, one location, Mansoria station in northern Kuwait, recorded a 50 percent increase in atmospheric methane due to a fire set by Iraq.
Oil infrastructure continues to be targeted now, regardless of the long-term environmental consequences. The diagram below, from the US Joint Chiefs of Staff Joint Targeting publication, illustrates all the options the United States considers available for targeting oil infrastructure.
In September 2014, the United States began to target ISIS-controlled oil production and distribution facilities as a means of cutting off revenue streams. In October 2015, the United States attacked more oil-producing ISIS-controlled infrastructure in what was known as Operation Tidal Wave II, targeting everything related to petroleum, including tanker trucks, oil well heads, oil pump jacks, oil refineries, gas-oil separation plants, and storage sites. An estimated 465,000 metric tons of methane were released when Russia’s natural gas pipelines to Europe, Nord Stream 1 and 2, were sabotaged in September 2022 during the war between Russia and Ukraine, equivalent to about 13.85 million metric tons of carbon dioxide equivalent—three times Albania’s annual emissions in 2024.
The US-Israeli war against Iran that began in February 2026 included dozens of attacks on Iranian fossil fuel infrastructure, including an Israeli strike on the largest gas field in the world, the South Pars gas field, on March 18, which caused the facility to shut down. Iran responded by attacking fossil fuel infrastructure in Qatar, United Arab Emirates, Abu Dhabi, and Saudi Arabia.
Systematic case studies of war related effects on emissions show how they ripple through time and space. Ukraine’s iron and steel production declined more than 60 percent in 2022 after Russia invaded, reducing emissions from that sector by an estimated 56.3 million metric tons of carbon dioxide equivalent during the first 18 months of the war. Russia destroyed a third of Ukraine’s public electricity and heat production, reducing emissions from that sector by 47.5 million metric tons during the first 18 months of the war.
But these reduced emissions have been more than offset by other attacks on the built and natural environment. The Ukrainian Nature Conservation Group has documented widespread degradation and destruction of the biosphere in Ukraine, including the bulldozing of forests and grasslands to build new roads to facilitate troop movement.
According to the Ukraine War Environmental Consequences Group, “Unusually hot and dry conditions—likely intensified by global warming—turned even minor sparks from combat into uncontrollable blazes, as firefighting remained impossible. This vicious cycle underscores how armed conflict and climate change exacerbate one another.” The Initiative on GHG Accounting of War under the direction of Lennard de Klerk has studied emissions from the war in Ukraine since February 2022. It estimates that the destruction of forests and other landscapes in Ukraine led to 70 million metric tons of carbon dioxide equivalent in emissions.
The initiative also calculated that during the first four years, military operations themselves generated an estimated 114 million metric tons of carbon dioxide equivalent. And because civil aviation has to avoid the airspace near the war zone, an additional nearly 30 million metric tons have been emitted in that sector. While there was a reduction in economic activity due to war caused disruption and destruction in Ukrainian industries, the Initiative estimates that rebuilding Ukraine will likely result in an additional 73 million metric tons of carbon dioxide equivalent emissions.
A team of scholars led by Ben Neimark has attempted to estimate the emissions of all phases of the Israel-Gaza war from pre-conflict, conflict, and reconstruction. The immediate human toll was staggering: Tens of thousands of people killed, millions displaced, and health care infrastructure in Gaza gutted. They estimate that “emissions from the open conflict surpassed 1.3 million tons CO2 equiv by January 2025,” but that including pre-war mobilization and post-war reconstruction, emissions from this war may be as high as 33 million metric tons of carbon dioxide equivalent.
Both these wars illustrate how the effects of military emissions extend beyond borders. The Russian invasion of Ukraine has caused increased military spending and military industrialization not only in Russia and Ukraine, but also in NATO, and increased global arms manufacturing as countries rush to supply Ukraine with weapons, much of which will outlast the war once it ends. Similarly, the Israel-Gaza war, which includes Israeli attacks in Lebanon and other countries, has generated increased military mobilization in the Middle East as well as increased arms sales. It may be fair to say that, since war became industrialized—if we take greenhouse gas emissions into account—there is no longer such thing as a purely local or regional war.
Nor are there purely strategic and political consequences of military mobilization and military spending. The Stockholm International Peace Research Institute notes that military spending has risen dramatically in the last 10 years. Increases in military spending tend to lead to increased military emissions. As Parkinson of Scientists for Global Responsibility notes in his analysis of 11 recent studies, the size of the projected emissions increase per $100 billion in constant 2023 spending ranged between .8 to 43 million metric tons of carbon dioxide equivalent, depending on how the military spending is allocated—for personnel, equipment, installations, or operations—and on the assumptions of the models. Parkinson’s own estimate is that for each $100 billion increase in military spending in constant 2023 prices, emissions will increase between 4 and 59 million metric tons of carbon dioxide equivalent.
The perils of ignorance and short-term thinking. While I have provided some “back of the envelope” estimates of military, military-industrial, and wartime emissions and compared my estimates to others, my estimate for annual military and military-industrial emissions is likely low. Even so, annual military and war related emissions are larger than the entire annual emissions of most of the world’s nations.
But there is so much more to know. That we don’t have hard numbers is due to some epistemic challenges: The raw data on military and military-industrial emissions remains largely unreported, and it is difficult to quantify wartime emissions from burning entire cities and forests and targeting petroleum facilities—especially if no one attempts to track these sources.
While it may be impossible to give a definitive number for military, military-industrial, and wartime emissions, ignoring those emissions could make the difference between bad and extremely bad outcomes. As the planet approaches climate tipping points, we need to know how much and how fast our emissions are accumulating in the atmosphere to avert the worst outcomes.
But there is a deeper question here: Why don’t we have the military and military-industrial data, and why do the impacts of war on emissions remain largely unexamined? On one level, as harmful as wartime greenhouse gas emissions may be, they are essentially not covered under either the laws of war or international humanitarian law. The 1976 Convention on the Prohibition of Military or Any Other Hostile Use of Environmental Modification Techniques is focused on “the deliberate manipulation of natural processes—the dynamics, composition or structure of the earth, including its biota, lithosphere, hydrosphere and atmosphere, or of outer space.” The greenhouse gas emissions of war are an unintended, albeit foreseeable and now foreseen side effect of combat.
Just as political leaders often aver that wars will be short, effective, decisive, cheap, and controllable—even if war is rarely any of those things—they assume that the environmental consequences of mobilization, armaments, and war are local, even trivial externalities, without long-term consequences that can change the planet itself. Indeed, in some respects, as soon as war and military industry began to be powered by fossil fuels in the 19th century, there was no longer any such thing as a purely “local” war.
Policymakers tend to assume that national security, understood as military security, is the sine qua non of survival. As the 1997 Pentagon memo urging that most or all military emissions be exempt from reporting explained, “We must not sacrifice our national security to achieve reductions in greenhouse gas emissions. We must not see this as an issue of being able to achieve either national security or protection of the global climate.” But to a certain extent, nonreporting, and the failure to count all other military, military-industrial, and war related emissions, may have done just that—put military capability and American preeminence above survival, and thus jeopardized the latter.
Bulletin of the Atomic Scientists
We hope you appreciated this article. At People’s World, we believe news and information should be free and accessible to all, but we need your help. Our journalism is free of corporate influence and paywalls because we are totally reader-supported. Only you, our readers and supporters, make this possible. If you enjoy reading People’s World and the stories we bring you, please support our work by donating or becoming a monthly sustainer today. Thank you!
CONTRIBUTOR