WASHINGTON (PAI) -You don’t have to dig particularly deep, in the United States today, to find some striking similarities between today’s virulently anti-Obama “Tea Party” crowd – and the pols like Sarah Palin who egg them on – and the media darlings who birthed the “Tax Revolt” phenomenon back in the late 1970s.
The Tax Revolters burst onto the national scene amid an inflation-battered economy. They blamed “big government” for what ailed America, and they offered a simple remedy: cut taxes, everywhere. Lower taxes, they promised, would get average Americans back on track.
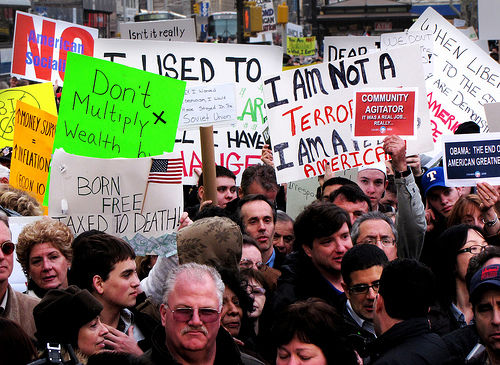
The Tea Party zealots have, like the Tax Revolters, also coalesced in tough economic times. They attack “big government,” too. They and their political enablers even make the same promises about taxes.
What they don’t do: Talk about how those original Tax Revolt promises worked out. We do, with the help of two just-released studies that document just how revolting – for average Americans – the “Tax Revolt” turned out to be.
In 1978, in a ballot-box stunner, California voters enacted an unprecedented cap on property taxes known as Prop 13. Within a few years, almost half of America’s states followed suit with tax cuts and caps of their own. So did some local governments.
In 1980, at the national level, this “Tax Revolt” surge carried Ronald Reagan into the White House. One year later, a pliant Congress gave President Reagan the biggest across-the-board federal tax cut in U.S. history.
Tax relief had become, in the wink of an eye, America’s most potent political creed. Tax cutting and capping would go on to dominate the nation’s political discourse for the next three decades, an entire generation. There was even tax relief rhetoric, from both parties, in last year’s presidential campaign.
But what do we have to show for all this cutting and capping? In mid-November, researchers produced two new studies that offer up a useful assessment.
The first, funded by the Social Security Administration, looks at the wealth of American families. That wealth, the Tax Revolters assured us, would start amassing again once taxpayers yanked “big government” out of our pockets.
The second new study zeroes in on state and local taxes. After years of tax revolting, this Institute on Taxation and Economic Policy report asks, who exactly is paying taxes at the state and local level? Who benefited the most, in tax terms, from the Tax Revolt which the Tea Party zealots now so fervently seek to extend?
The answer: The rich have benefited the most. The Tax Revolt that began back in the late 1970s has, in state after state, let the most affluent off the tax hook.
In fact, notes the new Institute on Taxation and Economic Policy analysis, “nearly every state and local tax system takes a much greater share of income from middle- and low-income families than from the wealthy.”
In the entire United States, this analysis adds, “Only two states require their best-off citizens to pay as much of their incomes in taxes as their very poorest taxpayers must pay, and only one state taxes its wealthiest individuals at a higher effective rate than middle-income families have to pay.”
America’s most affluent 1% now pay, on average, just 6.4% of their incomes in state and local taxes. But they actually pay even less than that, since they can deduct their state and local taxes from their federal tax bill. The state and local tax burden on America’s rich, after taking this offset into account, drops to 5.2%,or one of every $20.
Middle-income families – to be precise, those families who make up the middle fifth of America’s income distribution – pay, after the federal offset, 9.4% of their incomes in total state and local taxes. That’s one of every $11.
America’s poorest families pay even more. Tax collectors take 10.9% of the incomes of households in the nation’s bottom 20%, more than double the share they take from the incomes of the nation’s top 1%. The poor pay one of every $9 they earn to state and local taxes.
The Institute on Taxation and Economic Policy paper, Who Pays? A Distributional Analysis of the Tax Systems In All 50 States, covers non-elderly households. Incredibly, the study details, some states “ask their poorest residents – those in the bottom 20% of the income scale – to pay up to six times as much of their income in taxes as they ask the wealthy to pay.”
Now you could argue that none of this matters. The Tax Revolters, after all, didn’t claim their tax cutting and capping would have low- and middle-income people paying taxes at a lower rate than the rich. They claimed, instead, that massive tax cuts, taken as an amorphous whole, would help just about everybody get considerably richer.
That hasn’t happened, either, as Brookings Institution researchers Barry Bosworth and Rosanna Smart document in a paper just published by the Boston College Center for Retirement Research, with funding support from Social Security.
Bosworth and Smart “explore the consequences of the housing price bubble and its collapse for the wealth of older households.” Along the way, they dive into overall family wealth data the Federal Reserve has been collecting since the early 1980s. Tapping into another federal data set, they bring the family net worth picture up-to-date for 2009. For low- and middle-income families, their numbers tell a depressing story.
All American households – poor, middle, and rich – have lost wealth since the sub-prime mortgage collapse and last fall’s financial meltdown. On average, since 2007, Americans have lost 26% of their total net worth.
But low- and middle-income households under age 50 haven’t just lost a big chunk of the wealth they held in 2007. These households actually lost all the wealth they gained since 1983, the first year with Federal Reserve family wealth data available.
Back in 1983, the bottom third — by income — of U.S. families under age 50 had an average +$24,000 in net worth to their names, measured in year 2000 dollars. The housing bubble helped boost this bottom-third average net worth to +$27,000 in 2007.
Today, in the wake of that bubble’s collapse, researchers Bosworth and Smart put average bottom-third net worth at just +$17,000, in those same year 2000 dollars.
Middle-income households under age 50, meanwhile, held an average net worth of $50,000 in 1983. The current net worth of this middle third, after adjusting for inflation: $45,000.
Older households in the bottom and middle income thirds – those over age 50 – have, to be sure, seen their after-inflation net worth increase between 1983 and 2009. But even these households lost at least 22% of the wealth they held in 2007. As older families, Bosworth and Smart note, they now “have less time to recover.”
That recovery may take some time.
Back in the middle of the 20th century, governments in the U.S. routinely taxed the rich to pay for the programs that built a vibrant middle class. The Tax Revolt that began three decades ago, by demonizing taxes, gave the rich a free ride and gutted those programs. That demonization today continues, with politicos beholden to that rich class cynically fanning the Tea Party flames. Neither the pols nor the rich nor the Tea Partiers care who gets burned. The rest of us should.
Sam Pizzigati is editor of Too Much. This article is republished by Press Associates. Too Much is published by the Council on International and Public Affairs, a nonprofit research and education group. Office: 777 UN Plaza, New York, NY 10017. E-mail: editor@toomuchonline.org.
Photo: http://www.flickr.com/photos/ajagendorf25/ / CC BY 2.0
CONTRIBUTOR